
Argo Rollouts in Production: Canary, AnalysisTemplates, and the Gotchas Nobody Documents
It started with a routine Tuesday deploy. Nothing fancy, a small config change to our ingress controller across a few clusters. We'd done this a hundred times. Standard values.yaml modification and then letting ArgoCD do its magic, watch the rolling update do its thing, grab a Tea ( personal preference, you can grab a coffee as well ).
Famous last words.
By the time I checked the dashboards, three clusters were throwing 502s. The rolling update had dutifully cycled through pods, but it had no clue that the new config was messing up our TLS termination. It just kept going. That's the thing about Kubernetes Deployments, they're optimistic to a fault. They'll roll out bad code with the same enthusiasm as good code, and by the time your metrics catch up, you've already blasted through all your replicas.
I spent the afternoon writing rollback scripts and explaining to stakeholders why "production-ready" Kubernetes had just taken down three environments.
That was the day I stopped trusting kind: Deployment for anything that matters atleast on production.
The Problem Isn't Rolling Updates. Actually It's What They Can't See
Here's what they don't tell you in the tutorials: RollingUpdate isn't a deployment strategy, it's a pod replacement algorithm (yes I said what I said). It knows how to swap old pods for new ones without downtime. It has zero clue whether your application is actually working.
Think about what the native Deployment actually gives you:
Readiness probes — checks if a pod is ready, not if your release is healthy
Rolling updates — controls speed, not safety
Pause support — you can halt, but there's no automated rollback on failure
Umm, that's pretty much it, not counting the Pre-stop hooks and stuff
No traffic management between old and new versions. No external metric validation. No blast radius control. No ability to preview a release before it gets real traffic. Research tells us that 80% of production outages are caused by small changes, and the native Deployment has no opinion about any of them.
You want canary? Write it yourself with two Deployments and a fragile mess of Service selectors. You want automated rollback based on error rates? Build a custom controller. You want blue-green with preview environments? Good luck.
The Kubernetes community will tell you "use Argo Rollouts!" — and they're right. But most tutorials stop at "here's how to replace Deployment with Rollout for blue-green." Let me show you what actually matters when you're running this in anger.
kind: Rollout vs kind: Deployment — The Actual Diff
The first CRD is kind: Rollout. It's marketed as a drop-in replacement for kind: Deployment, and it mostly is but as a DevOps Engineer you can't bet everything on mostly it should work, so let's be precise about what changes.
Here's a native Deployment:
apiVersion: apps/v1
kind: Deployment
metadata:
  name: my-app
spec:
  replicas: 10
  selector:
    matchLabels:
      app: my-app
  strategy:
    type: RollingUpdate
    rollingUpdate:
      maxSurge: 1
      maxUnavailable: 0
  template:
    metadata:
      labels:
        app: my-app
    spec:
      containers:
      - name: app
        image: my-app:v1
        ports:
        - containerPort: 8080
And here's the equivalent kind: Rollout:
apiVersion: argoproj.io/v1alpha1  # <-- changed
kind: Rollout                      # <-- changed
metadata:
  name: my-app
spec:
  replicas: 10
  selector:
    matchLabels:
      app: my-app
  strategy:                        # <-- this whole block changes
    canary:
      steps:
      - setWeight: 10
      - pause:
          duration: 10m.
      - setWeight: 50
      - pause:
          duration: 10m
      - setWeight: 100
      analysis:
        templates:
        - templateName: standard-health-check
        args:
        - name: service
          value: my-app.default.svc.cluster.local
  template:
    metadata:
      labels:
        app: my-app
    spec:
      containers:
      - name: app
        image: my-app:v1
        ports:
        - containerPort: 8080
Three things change: the apiVersion, the kind, and the strategy block. Everything else — selector, replicas, template, container spec — is identical. The controller picks it up and manages two ReplicaSets (stable + canary) behind the scenes.
One important gotcha: Argo Rollouts creates and manages its own ReplicaSets, so if you migrate an existing Deployment, delete the Deployment first. Running both simultaneously causes a conflict over the same pods.
How to migrate from kind: Deployment to kind: Rollout without downtime is a whole differet story, that would need a seperate blog post.
The Canary Problem Nobody Talks About
Before we go further, there's a widely misunderstood behaviour that'll bite you if you skip it.
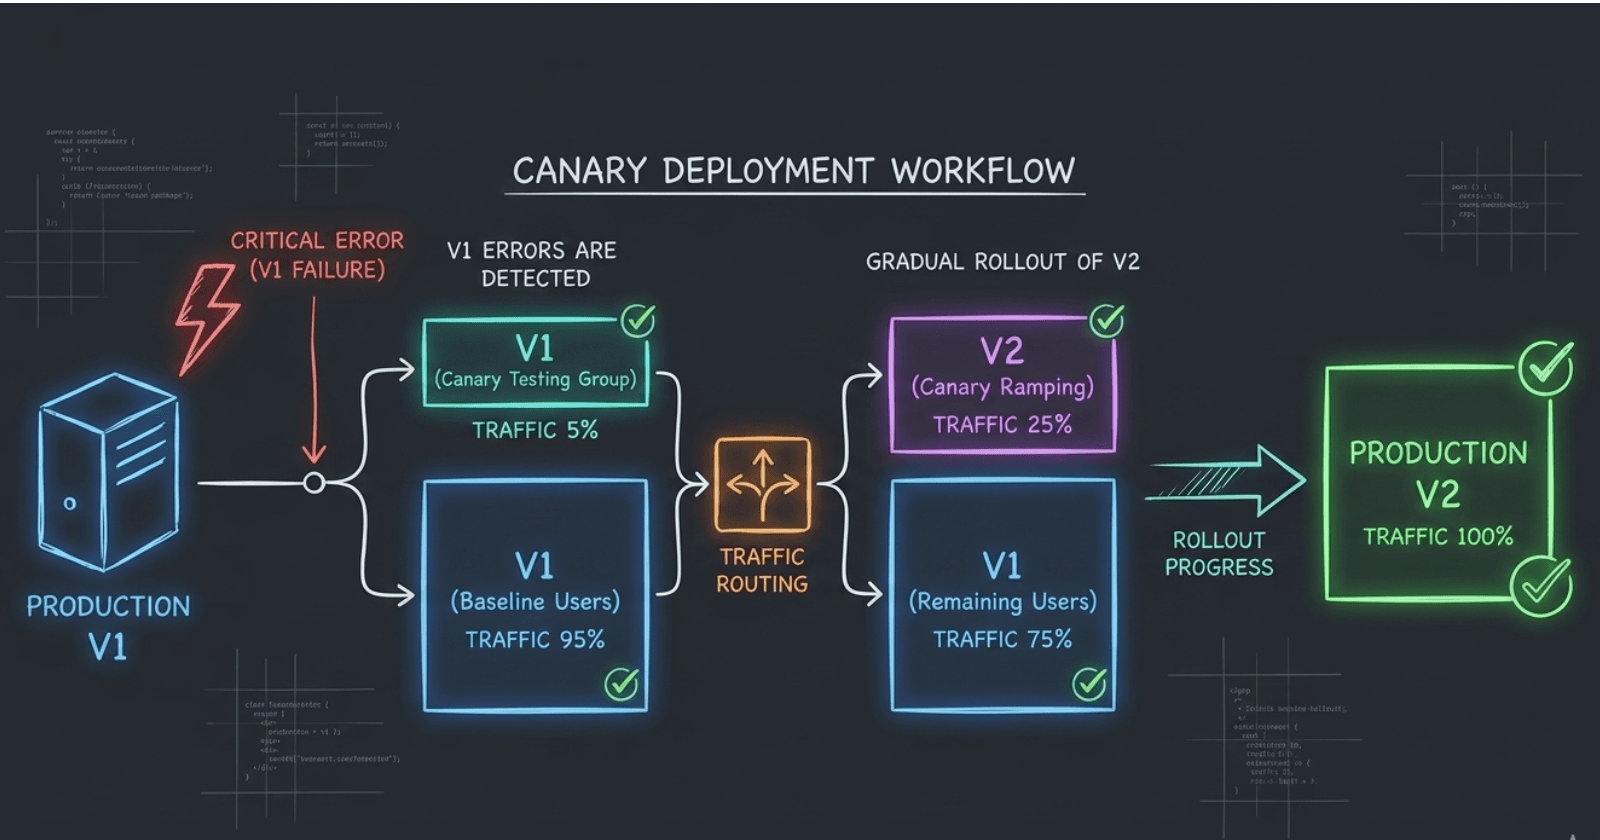
When you set setWeight: 30 in a canary step, most people assume 30% of your users get the new version. That's not what happens. Argo Rollouts guarantees that 30% of network requests go to canary, but those requests are completely random. The same user can hit stable on request 1, canary on request 2, and stable again on request 3. For stateless APIs this is tolerable. For anything with session state, user-specific features, or UI changes, this is a disaster.
The Fix: Header-Based Routing
You need a traffic provider (NGINX Ingress, Istio, Traefik, etc.) and a dedicated canary URL per user group. Here's how it looks with NGINX:
apiVersion: argoproj.io/v1alpha1
kind: Rollout
metadata:
  name: my-app
spec:
  strategy:
    canary:
      canaryService: my-app-canary   # separate Service for canary pods
      stableService: my-app-stable   # separate Service for stable pods
      trafficRouting:
        nginx:
          stableIngress: my-app-ingress
          annotationPrefix: nginx.ingress.kubernetes.io
          additionalIngressAnnotations:
            canary-by-header: X-Canary-User
            canary-by-header-value: "true"
      steps:
      - setWeight: 10
      - pause:
          duration: 10m
      - setWeight: 50
      - pause:
          duration: 10m
Now requests with the header X-Canary-User: true always hit the canary. Everyone else stays on stable. You can give this header to internal testers, beta users, or a specific account tier — controlled, consistent, reproducible canary exposure.
Decoupling Traffic from Replicas: setCanaryScale
By default, Argo Rollouts scales canary replicas proportionally to traffic weight. At 10% traffic, you get ~10% of your total replica count. This can cause resource issues — at 10 replicas total, 10% traffic with 1 canary pod means that pod is handling a tenth of your prod load with zero redundancy.
setCanaryScale fixes this:
steps:
- setWeight: 10
- setCanaryScale:
    replicas: 3        # always keep 3 canary pods regardless of weight
- pause:
    duration: 10m
- setWeight: 50
- setCanaryScale:
    matchTrafficWeight: true   # now scale proportionally
This is critical for cost efficiency in large clusters so you're not spinning up 50 canary pods the moment you hit 50% traffic weight.
Manual Gates: Explicit Human Approval
Automated analysis is great. But sometimes you want a person to look at dashboards before traffic increases. Use pause: {duration: 0}:
steps:
- setWeight: 10
- pause:
    duration: 10m      # timed pause — auto-advances
- setWeight: 30
- pause: {}                   # indefinite pause — REQUIRES manual promotion
- setWeight: 100
An indefinite pause blocks until someone runs kubectl argo rollouts promote my-app or clicks Promote in the dashboard. Ideal for compliance-gated releases or high-stakes deploys.
AnalysisTemplate: Executable Success Criteria
I used to think monitoring was enough. "We'll watch the dashboards and roll back if things go south." Cute. By the time a you are back after grabbing the cup of tea, you've already served errors to real users for minutes.
AnalysisTemplate is where you define what "goooood" looks like, not vague SLOs buried in a wiki, but actual executable queries against your metrics provider.
apiVersion: argoproj.io/v1alpha1
kind: AnalysisTemplate
metadata:
  name: error-rate-check
spec:
  args:
  - name: service-name
  metrics:
  - name: success-rate
    interval: 5m
    successCondition: result[0] >= 0.95
    failureLimit: 3
    provider:
      prometheus:
        address: http://prometheus:9090
        query: |
          sum(rate(
            requests_total{service="{{args.service-name}}",status!~"5.."}[5m]
          )) /
          sum(rate(
            requests_total{service="{{args.service-name}}"}[5m]
          ))
The failureLimit: 3 is important, it means the analysis can fail up to 3 consecutive checks before the rollout aborts. This prevents a single metric spike from triggering a premature rollback. Tune this based on your traffic patterns.
Beyond Prometheus — The Providers You're Not Using
Most blogs show only Prometheus. Here's the full picture:
| Provider | Use Case |
|---|---|
| Prometheus | Error rates, latency, saturation — the default |
| Datadog | If your org is Datadog-first; same PromQL-style queries |
| New Relic / CloudWatch | Cloud-native shops already invested in these |
| InfluxDB / Wavefront | IoT or high-frequency telemetry workloads |
| HTTP Endpoint | Call any arbitrary URL and evaluate the response |
| Kubernetes Job | Run any test script as a gate — massively underrated |
The Kubernetes Job provider deserves special attention. It lets you run integration tests, smoke tests, or any shell script as an analysis step:
metrics:
- name: integration-test
  provider:
    job:
      spec:
        template:
          spec:
            containers:
            - name: test-runner
              image: my-test-runner:latest
              command: ["pytest", "tests/smoke/", "-v"]
            restartPolicy: Never
        backoffLimit: 0
If the Job exits 0, analysis passes. Non-zero means failure, rollback triggers. This is how you gate a canary on actual test results, not just infrastructure metrics.
ClusterAnalysisTemplate — Define Once, Use Everywhere
If you're managing multiple namespaces (and you are), use ClusterAnalysisTemplate instead of AnalysisTemplate. It's cluster-scoped — define it once, reference it from any Rollout in any namespace:
apiVersion: argoproj.io/v1alpha1
kind: ClusterAnalysisTemplate   # <-- cluster-scoped
metadata:
  name: standard-health-check
spec:
  args:
  - name: service
  metrics:
  - name: success-rate
    interval: 5m
    successCondition: result[0] >= 0.95
    failureLimit: 3
    provider:
      prometheus:
        address: http://prometheus.monitoring:9090
        query: |
          sum(rate(
            istio_requests_total{
              destination_service=~"{{args.service}}",
              response_code!~"5.*"
            }[5m]
          )) /
          sum(rate(
            istio_requests_total{
              destination_service=~"{{args.service}}"
            }[5m]
          ))
When your Prometheus address changes (and it will), you update one file. Not fifty.
AnalysisRun: The Live Execution You Should Actually Inspect
AnalysisRun is the third CRD, and it's the one people forget to look at during an active rollout. It's the live execution of an AnalysisTemplate — one gets created automatically each time a Rollout triggers an analysis.
An AnalysisRun has three possible outcomes:
Successful → Argo Rollouts advances to the next step
Failed → Rollout aborts, traffic snaps back to stable, canary scales to zero
Inconclusive → Rollout pauses, waits for manual judgment (useful when metrics are ambiguous)
The most useful thing you can do during a live canary is inspect the AnalysisRun directly:
# See all analysis runs for a rollout
kubectl argo rollouts get rollout my-app

# Detailed view of a specific analysis run
kubectl describe analysisrun my-app-<hash>

# Watch it live
kubectl argo rollouts get rollout my-app --watch
The --watch flag is your best friend. It gives you a live terminal view of step progression, traffic weights, and analysis status without needing to open the dashboard.
You can also run an AnalysisTemplate independently, outside of a Rollout, for dry-run validation:
apiVersion: argoproj.io/v1alpha1
kind: AnalysisRun
metadata:
  name: dry-run-health-check
spec:
  args:
  - name: service-name
    value: my-app.default.svc.cluster.local
  templates:
  - templateName: error-rate-check
Run this before wiring analysis into a production Rollout. Validate your PromQL actually returns what you think it returns. Save yourself the embarrassment of an analysis that always passes because the query is wrong.
kind: Experiment- A/B Testing Inside Your Pipeline
Last year, we were migrating from GKE to a multi-cloud setup. Needed to verify our app behaved identically across regions with different latency profiles. Normally, you'd do this manually spin up a test deployment, run some benchmarks, compare.
Enter kind: Experiment. It lets you run multiple ReplicaSets side-by-side for a set duration, with optional analysis on each. Think of it as Kayenta-style comparison analysis, but native to your deployment pipeline.
The most common use case isn't standalone experiments though — it's embedding them as a canary step:
# Inside a Rollout's canary steps
steps:
- experiment:
    duration: 30m
    templates:
    - name: baseline
      specRef: stable        # uses the current stable spec
    - name: canary
      specRef: canary        # uses the new canary spec
    analyses:
    - name: compare-latency
      templateName: p95-latency-comparison
      args:
      - name: baseline-service
        value: "{{templates.baseline.service.name}}"
      - name: canary-service
        value: "{{templates.canary.service.name}}"
Both versions run in parallel for 30 minutes. Your analysis compares their p95 latency side-by-side. If canary is statistically worse, the experiment fails and the rollout aborts, before a single real user sees the new version.
That's not a deployment strategy. That's engineering confidence.
The Argo Rollouts Dashboard: Yes There's a GUI of your Control Room
Here's what most tutorials skip entirely: there's a full web UI, and it's actually good.
Install the kubectl plugin first if you haven't:
# macOS
brew install argoproj/tap/kubectl-argo-rollouts

# Linux
curl -LO https://github.com/argoproj/argo-rollouts/releases/latest/download/kubectl-argo-rollouts-linux-amd64
chmod +x kubectl-argo-rollouts-linux-amd64
mv kubectl-argo-rollouts-linux-amd64 /usr/local/bin/kubectl-argo-rollouts
Then launch the dashboard:
kubectl argo rollouts dashboard
It opens on http://localhost:3100. What you get:
Live rollout status — step progression, current traffic weights, active canary vs stable pod counts
AnalysisRun status — each metric check, pass/fail, consecutive failures, timestamps
One-click controls — Promote, Abort, Retry directly from the UI without touching kubectl
Rollout history — every revision with its status and timestamp
This is the thing to show your team when you're making the case for Argo Rollouts. Watching a canary step from 10% → 50% in real-time while analysis checks tick green is more persuasive than any architecture diagram.
For production, you can use the argo-rollouts controller helm chart and enable dashboard there, they also support enabling ingress for dashboard so you are mostly set. If you have already migrated the nginx controller to Gateway you might have to write a seperate HTTPRoute, if not you can use a loadbalancer to access it. Make sure that its only internally accessible and not public facing :).
Here's the Github Repo Link to Helm chart incase:- https://github.com/argoproj/argo-helm/tree/main/charts/argo-rollouts
Notifications — The Part Everyone Gets Wrong
Argo Rollouts has native notification support since v1.1, with self-service namespace configuration since v1.6, but most setups are half-baked. Teams wire up on-rollout-aborted and call it done, which is one event out of nine and usually not even the most actionable one. Most blogs show the annotation and stop there. Here's the full wiring.
Step 1: Create the Slack Token Secret
kubectl create secret generic argo-rollouts-notification-secret \
  --from-literal=slack-token=xoxb-your-slack-bot-token \
  -n argo-rollouts
Step 2: Configure the Notification ConfigMap
This is where triggers and templates live. Apply it in the argo-rollouts namespace for cluster-wide defaults:
apiVersion: v1
kind: ConfigMap
metadata:
  name: argo-rollouts-notification-cm
  namespace: argo-rollouts
data:
  # Slack integration
  service.slack: |
    token: $slack-token

  # Message templates
  template.rollout-aborted: |
    message: |
      :red_circle: Rollout *{{.rollout.metadata.name}}* aborted in namespace *{{.rollout.metadata.namespace}}*
      Reason: {{.rollout.status.message}}
      Canary weight at time of abort: {{.rollout.status.currentPodHash}}

  template.analysis-run-failed: |
    message: |
      :warning: Analysis failed for *{{.rollout.metadata.name}}*
      Failed metric: {{range .analysisRun.status.metricResults}}{{if eq .phase "Failed"}}{{.name}}{{end}}{{end}}
      Initiating automatic rollback.

  template.rollout-completed: |
    message: |
      :white_check_mark: Rollout *{{.rollout.metadata.name}}* completed successfully.
      New stable image: {{range .rollout.spec.template.spec.containers}}{{.image}}{{end}}

  template.rollout-paused: |
    message: |
      :pause_button: Rollout *{{.rollout.metadata.name}}* paused — awaiting manual promotion.
      Promote with: `kubectl argo rollouts promote {{.rollout.metadata.name}} -n {{.rollout.metadata.namespace}}`

  # Triggers — maps events to templates
  trigger.on-rollout-aborted: |
    - send: [rollout-aborted]

  trigger.on-analysis-run-failed: |
    - send: [analysis-run-failed]

  trigger.on-rollout-completed: |
    - send: [rollout-completed]

  trigger.on-rollout-paused: |
    - send: [rollout-paused]
Step 3: Annotate Your Rollout
Now teams can self-subscribe to any trigger without touching the central configmap (the v1.6 self-service model):
apiVersion: argoproj.io/v1alpha1
kind: Rollout
metadata:
  name: my-app
  annotations:
    # Alert on abort and analysis failure
    notifications.argoproj.io/subscribe.on-rollout-aborted.slack: "#alerts-team-a"
    notifications.argoproj.io/subscribe.on-analysis-run-failed.slack: "#alerts-team-a"
    # Notify on success too — close the loop
    notifications.argoproj.io/subscribe.on-rollout-completed.slack: "#deploys-team-a"
    # Alert when a manual gate is waiting for promotion
    notifications.argoproj.io/subscribe.on-rollout-paused.slack: "#deploys-team-a"
The nine built-in triggers cover the full lifecycle:
| Trigger | When It Fires |
|---|---|
on-rollout-updated |
A new rollout revision starts |
on-rollout-step-completed |
Each canary step completes |
on-rollout-paused |
Rollout pauses (manual gate or analysis inconclusive) |
on-rollout-completed |
Rollout reaches 100% stable |
on-rollout-aborted |
Rollout aborts for any reason |
on-analysis-run-started |
An AnalysisRun begins |
on-analysis-run-completed |
An AnalysisRun finishes |
on-analysis-run-failed |
An AnalysisRun fails |
on-analysis-run-error |
Provider error (e.g., Prometheus unreachable) |
The on-analysis-run-error trigger is one people forget. If your Prometheus goes down mid-canary, you want to know immediately, not discover it when you wonder why the rollout is stuck.
Argo Rollouts + Argo CD: The GitOps Stack
A common source of confusion: Argo CD and Argo Rollouts are not the same tool, and they solve different problems.
Argo CD ensures your cluster matches the desired state in Git. It's a reconciliation engine. It sees your
kind: Rolloutmanifest in Git and syncs it to the cluster.Argo Rollouts controls how the transition from old to new happens once that manifest lands. It manages the traffic shifting, analysis, and promotion/rollback logic.
The workflow looks like this:
Developer pushes new image tag to Git
        ↓
Argo CD detects the diff and syncs the Rollout spec
        ↓
Argo Rollouts controller picks up the new spec
        ↓
Canary step begins: 10% traffic → AnalysisRun starts
        ↓
Analysis passes → 50% → analysis passes → 100%
        ↓
New version is stable. Argo CD shows "Synced + Healthy"
One important config when using both together: set ignoreDifferences in your Argo CD Application and enable respectIgnoreDifferences to avoid Argo CD fighting Argo Rollouts over the replica count during a canary.
Step 1 — Argo CD Application:
apiVersion: argoproj.io/v1alpha1
kind: Application
metadata:
  name: my-app
spec:
  syncOptions:
    - RespectIgnoreDifferences=true
  ignoreDifferences:
  - group: argoproj.io
    kind: Rollout
    jsonPointers:
    - /spec/replicas   # Argo Rollouts manages this during canary
Without both, Argo CD will try to sync the replica count back to what's in Git while Argo Rollouts is actively scaling canary pods. The two controllers fight each other and you get undefined behaviour.
The Complete Production Ready Example
Here's everything tied together, the kind of manifest I wish someone had shown me before I learned it the expensive way:
# 1. ClusterAnalysisTemplate — define once, use everywhere
apiVersion: argoproj.io/v1alpha1
kind: ClusterAnalysisTemplate
metadata:
  name: standard-health-check
spec:
  args:
  - name: service
  metrics:
  - name: success-rate
    interval: 5m
    successCondition: result[0] >= 0.95
    failureLimit: 3
    provider:
      prometheus:
        address: http://prometheus.monitoring:9090
        query: |
          sum(rate(
            istio_requests_total{
              destination_service=~"{{args.service}}",
              response_code!~"5.*"
            }[5m]
          )) /
          sum(rate(
            istio_requests_total{
              destination_service=~"{{args.service}}"
            }[5m]
          ))
  - name: p95-latency
    interval: 5m
    successCondition: result[0] <= 500   # ms
    failureLimit: 2
    provider:
      prometheus:
        address: http://prometheus.monitoring:9090
        query: |
          histogram_quantile(0.95,
            sum(rate(
              istio_request_duration_milliseconds_bucket{
                destination_service=~"{{args.service}}"
              }[5m]
            )) by (le)
          )

---
# 2. The Rollout
apiVersion: argoproj.io/v1alpha1
kind: Rollout
metadata:
  name: my-app
  annotations:
    notifications.argoproj.io/subscribe.on-rollout-aborted.slack: "#alerts-my-team"
    notifications.argoproj.io/subscribe.on-analysis-run-failed.slack: "#alerts-my-team"
    notifications.argoproj.io/subscribe.on-rollout-completed.slack: "#deploys-my-team"
    notifications.argoproj.io/subscribe.on-rollout-paused.slack: "#deploys-my-team"
spec:
  replicas: 10
  selector:
    matchLabels:
      app: my-app
  template:
    metadata:
      labels:
        app: my-app
    spec:
      containers:
      - name: app
        image: my-app:v2
        ports:
        - containerPort: 8080
  strategy:
    canary:
      canaryService: my-app-canary
      stableService: my-app-stable
      trafficRouting:
        nginx:                    # Can use ALB, Istio, Traefik (Gateway is Supported via plugins haven't explored it yet)
          stableIngress: my-app-ingress
      steps:
      - setWeight: 10
      - setCanaryScale:
          replicas: 3             # stable replica count regardless of weight
      - pause:
          duration: 10m          # timed: auto-advances after 10m
      - setWeight: 30
      - pause: {}                # manual gate: requires explicit promotion
      - setWeight: 60
      - pause:
          duration: 10m
      - setWeight: 100
      analysis:
        startingStep: 1          # analysis starts after first setWeight
        templates:
        - templateName: standard-health-check
          clusterScope: true     # use ClusterAnalysisTemplate
        args:
        - name: service
          value: my-app.default.svc.cluster.local
Flagger: The Elephant in the Room
Flagger is worth mentioning because the question always comes up. The fundamental difference is architectural: Flagger wraps your existing kind: Deployment rather than replacing it, which matters if migrating manifests feels risky or if you're already deep in the Flux ecosystem. Argo Rollouts also supports referencing an existing Deployment without replacing it, similar to how Flagger works.
But tradeoff is real. Flagger's surface area is smaller and its GitOps integration with Flux is excellent. Argo Rollouts gives you more granular step control, a dashboard, and the Experiment CRD. Neither is wrong, they reflect different team philosophies. If you're Flux-native, evaluate Flagger first. If you want the full progressive delivery toolkit in one place, you're already in the right article.
When NOT to Use Argo Rollouts
This is the section most blogs skip because it doesn't sell the tool. But every senior engineer respects a writer who gives them the failure modes upfront.
Don't use Argo Rollouts for:
Infrastructure controllers — cert-manager, nginx, coredns, sealed-secrets. These aren't application deployments; they're cluster plumbing. A canary of your ingress controller is chaos.
Applications with shared mutable state — if your app writes to a shared file, a shared queue, or a shared database schema without backward compatibility, running two versions simultaneously will corrupt data.
Worker/queue consumers — apps that pull from a queue typically can't handle two versions processing the same messages. Argo Rollouts doesn't control queue routing.
Long-lived parallel versions — Argo Rollouts assumes a brief deployment window (15–60 minutes typically, 1–2 hours max). Running canary for days or weeks before deciding to promote creates operational complexity and rollback ambiguity.
Multi-cluster rollouts — Argo Rollouts operates within a single cluster. If you need coordinated rollouts across clusters, look at Argo CD ApplicationSets or multi-cluster progressive delivery tools.
Legacy apps that can't run multiple versions concurrently — some apps hold exclusive locks, bind to fixed ports, or have singleton assumptions. For these, Blue-Green (not canary) is your only option, and even that requires validation.
And a note on StatefulSets and DaemonSets: as of Argo Rollouts 1.9, support for these workload types is in active development. Don't try to use kind: Rollout as a drop-in for kind: StatefulSet. NO it won't work for now.
The Bottom Line for Production Deployments
If you're still using kind: Deployment for anything that matters, you're gambling. Not because Kubernetes is bad, it's not. But Deployments were designed for a simpler era. They assume your code is either "ready" or "not ready." Real production systems are more nuanced than that.
The four CRDs Rollout, AnalysisTemplate, AnalysisRun, and Experiment aren't just features. They're the difference between "deploy and hope" and actual progressive delivery. Layer in the dashboard for visibility, notifications for observability and header-based routing for controlled canary exposure and you've built a deployment pipeline that can catch problems before your users do.
Start with Rollout as a drop-in replacement. Add ClusterAnalysisTemplate when you're ready to automate pass/fail decisions. Use the dashboard during live canaries. Wire up notifications properly — all the triggers, not just abort. And when you're feeling brave, Experiment will change how you think about pre-production testing.
One more thing: set pause: {} for your first few production canaries. Get comfortable promoting manually. Understand what "good" looks like in your AnalysisRun output. Then, and only then, remove the manual gate and let the system decide.
Future you will thank present you when a canary fails at 2 AM and the right Slack channel gets paged before any person notices.
Now you don't need to hurry back after grabbing your tea, go and have an easy sip, let Rollouts handle the prod.
Working with Kubernetes across multi-cloud setups, one bad deploy at a time. Follow along as I document the stuff they don't put in the docs.